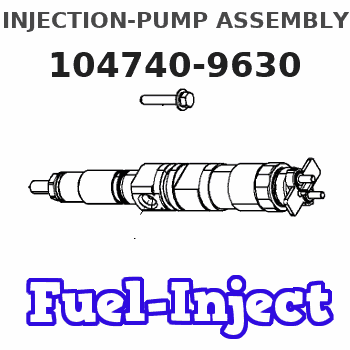
Information injection-pump assembly
ZEXEL
104740-9630
1047409630
NISSAN-DIESEL
1670044G01
1670044g01
Rating:
Cross reference number
ZEXEL
104740-9630
1047409630
NISSAN-DIESEL
1670044G01
1670044g01
Zexel num
Bosch num
Firm num
Name
Calibration Data:
Adjustment conditions
Test oil
1404 Test oil ISO4113orSAEJ967d
1404 Test oil ISO4113orSAEJ967d
Test oil temperature
degC
45
45
50
Nozzle
105000-2010
Bosch type code
NP-DN12SD12TT
Nozzle holder
105780-2080
Opening pressure
MPa
14.7
14.7
15.19
Opening pressure
kgf/cm2
150
150
155
Injection pipe
Inside diameter - outside diameter - length (mm) mm 2-6-840
Inside diameter - outside diameter - length (mm) mm 2-6-840
Transfer pump pressure
kPa
20
20
20
Transfer pump pressure
kgf/cm2
0.2
0.2
0.2
Direction of rotation (viewed from drive side)
Right R
Right R
Injection timing adjustment
Pump speed
r/min
1100
1100
1100
Average injection quantity
mm3/st.
48.2
47.7
48.7
Difference in delivery
mm3/st.
3
Basic
*
Oil temperature
degC
50
48
52
Injection timing adjustment_02
Pump speed
r/min
600
600
600
Average injection quantity
mm3/st.
46.8
44.8
48.8
Oil temperature
degC
50
48
52
Injection timing adjustment_03
Pump speed
r/min
1100
1100
1100
Average injection quantity
mm3/st.
48.2
47.2
49.2
Difference in delivery
mm3/st.
3.5
Basic
*
Oil temperature
degC
50
48
52
Injection timing adjustment_04
Pump speed
r/min
2150
2150
2150
Average injection quantity
mm3/st.
40.4
38.4
42.4
Oil temperature
degC
52
50
54
Injection timing adjustment_05
Pump speed
r/min
2300
2300
2300
Average injection quantity
mm3/st.
32.6
29.1
36.1
Oil temperature
degC
52
50
54
Injection quantity adjustment
Pump speed
r/min
2500
2500
2500
Average injection quantity
mm3/st.
12
10
14
Basic
*
Oil temperature
degC
55
52
58
Injection quantity adjustment_02
Pump speed
r/min
2700
2700
2700
Average injection quantity
mm3/st.
5
Oil temperature
degC
55
52
58
Injection quantity adjustment_03
Pump speed
r/min
2500
2500
2500
Average injection quantity
mm3/st.
12
9
15
Basic
*
Oil temperature
degC
55
52
58
Governor adjustment
Pump speed
r/min
350
350
350
Average injection quantity
mm3/st.
6.5
4.5
8.5
Difference in delivery
mm3/st.
2
Basic
*
Oil temperature
degC
48
46
50
Governor adjustment_02
Pump speed
r/min
350
350
350
Average injection quantity
mm3/st.
6.5
4
9
Difference in delivery
mm3/st.
2.5
Basic
*
Oil temperature
degC
48
46
50
Timer adjustment
Pump speed
r/min
100
100
100
Average injection quantity
mm3/st.
60
45
80
Basic
*
Oil temperature
degC
48
46
50
Remarks
Full
Full
Timer adjustment_02
Pump speed
r/min
100
100
100
Average injection quantity
mm3/st.
60
45
80
Oil temperature
degC
48
46
50
Speed control lever angle
Pump speed
r/min
350
350
350
Average injection quantity
mm3/st.
0
0
0
Oil temperature
degC
48
46
50
Remarks
Magnet OFF at idling position
Magnet OFF at idling position
0000000901
Pump speed
r/min
1100
1100
1100
Overflow quantity with S/T ON
cm3/min
390
260
520
Oil temperature
degC
50
48
52
_02
Pump speed
r/min
1100
1100
1100
Overflow quantity with S/T ON
cm3/min
490
360
620
Oil temperature
degC
50
48
52
Remarks
Without an O-ring
Without an O-ring
Stop lever angle
Pump speed
r/min
1700
1700
1700
Pressure with S/T ON
kPa
618
579
657
Pressure with S/T ON
kgf/cm2
6.3
5.9
6.7
Pressure with S/T OFF
kPa
510
481
539
Pressure with S/T OFF
kgf/cm2
5.2
4.9
5.5
Basic
*
Oil temperature
degC
50
48
52
Remarks
OFF
OFF
Stop lever angle_02
Pump speed
r/min
1700
1700
1700
Pressure with S/T OFF
kPa
510
471
549
Pressure with S/T OFF
kgf/cm2
5.2
4.8
5.6
Basic
*
Oil temperature
degC
50
48
52
Stop lever angle_03
Pump speed
r/min
2150
2150
2150
Pressure with S/T OFF
kPa
598
559
637
Pressure with S/T OFF
kgf/cm2
6.1
5.7
6.5
Oil temperature
degC
52
50
54
0000001101
Pump speed
r/min
1700
1700
1700
Timer stroke with S/T ON
mm
6.5
6.1
6.9
Timer stroke with S/T OFF
mm
4.9
4.7
5.1
Basic
*
Oil temperature
degC
50
48
52
_02
Pump speed
r/min
700
700
700
Timer stroke with S/T OFF
mm
0.5
0.5
Oil temperature
degC
50
48
52
_03
Pump speed
r/min
1100
1100
1100
Timer stroke with S/T ON
mm
4.3
3.7
4.9
Timer stroke with S/T OFF
mm
2.6
2
3.2
Oil temperature
degC
50
48
52
_04
Pump speed
r/min
1700
1700
1700
Timer stroke with S/T OFF
mm
4.9
4.5
5.3
Basic
*
Oil temperature
degC
50
48
52
_05
Pump speed
r/min
2500
2500
2500
Timer stroke with S/T OFF
mm
7.4
6.9
7.8
Oil temperature
degC
55
52
58
0000001201
Max. applied voltage
V
8
8
8
Test voltage
V
13
12
14
Timing setting
K dimension
mm
3.3
3.2
3.4
KF dimension
mm
5.8
5.7
5.9
MS dimension
mm
1
0.9
1.1
Control lever angle alpha
deg.
25
23
27
Control lever angle beta
deg.
36
31
41
Information:
API Degrees - Temperature Correction Chart for Diesel Fuel
Record the corrected API gravity from this chart.Table of Horsepower Correction Factors
Table 2
Corrected API
Gravity at 60° F Precombustion
Chamber Engines Direct Injection Engines (Use the correct full load RPM)
1800 2000 2200 2400 2600 2800 3000 3200
32.0
32.5
33.0
33.5
34.0 .984
.987
.990
.992
.995 .986
.988
.990
.992
.995 .986
.988
.990
.992
.995 .986
.988
.990
.992
.995 .986
.988
.990
.992
.995 .986
.988
.990
.992
.995 .986
.988
.990
.992
.995 .986
.988
.990
.992
.995 .986
.988
.990
.992
.995
34.5
35.0
35.5
36.0
36.5 .997
1.000
1.003
1.005
1.008 .998
1.000
1.003
1.007
1.013 .998
1.000
1.003
1.007
1.010 .998
1.000
1.004
1.007
1.011 .998
1.000
1.004
1.007
1.011 .998
1.000
1.004
1.007
1.011 .998
1.000
1.004
1.008
1.012 .998
1.000
1.004
1.008
1.012 .998
1.000
1.004
1.008
1.012
37.0
37.5
38.0
38.5
39.0 1.011
1.014
1.017
1.020
1.023 1.014
1.018
1.022
1.025
1.029 1.014
1.018
1.022
1.026
1.030 1.014
1.018
1.022
1.026
1.030 1.015
1.019
1.022
1.026
1.030 1.015
1.019
1.023
1.027
1.031 1.016
1.020
1.024
1.028
1.032 1.016
1.020
1.024
1.028
1.033 1.016
1.021
1.025
1.029
1.034
39.5
40.0
40.5
41.0
41.5 1.027
1.030
1.034
1.038
1.043 1.034
1.038
1.043
1.048
1.053 1.034
1.038
1.043
1.048
1.054 1.034
1.039
1.044
1.049
1.055 1.035
1.040
1.045
1.050
1.056 1.036
1.040
1.045
1.051
1.056 1.036
1.041
1.046
1.051
1.057 1.037
1.042
1.047
1.053
1.059 1.039
1.045
1.047
1.057
1.064
42.0
42.5
43.0
43.5
44.0 1.047
1.053
1.060
1.067
1.076 1.059
1.066
1.073
1.082
1.095 1.060
1.067
1.074
1.084
1.096 1.061
1.068
1.076
1.085
1.098 1.062
1.069
1.077
1.086
1.099 1.063
1.070
1.078
1.087
1.100 1.064
1.071
1.079
1.088
1.102 1.066
1.072
1.081
1.091
1.105 1.072
1.080
1.089
1.099
1.115 Use the above chart to find the horsepower correction factor.Calculating the Corrected Horsepower
Determine the rated full load horsepower from the Rack Setting Information Book.
Divide the rated horsepower by the horsepower correction factor for fuel density; the result is the corrected horsepower.Example:1674 - Truck Engine Serial No. 94B2551Rated Horsepower: 270 HorsepowerCalculations:
Table 3
1. Measured API gravity: 40.4' API at 50' (round to 40' API)
2. Corrected API gravity (see chart): 41' API at 60'F
3. Hpr correction factor (see chart): 1.038
4. Corrected Hp = Rated Hpr = 270 = 260 Hp
Correction Factor 1.038 (or 3.75% hp loss) Correcting for Fuel Density When Testing Engines on a Dynamometer
When engines are tested on a dynamometer which measures actual flywheel or drive train output, the observed horsepower is dependent on the fuel used. If the fuel being used is not 35° API at 60°F, then any dynamometer readings must be corrected to determine the output if 35° API fuel had been used. The same horsepower correction factor is used, but the formula is different:Corrected Horsepower = Observed Horsepower x Horsepower Correction FactorExample:1674 Truck Engine, Serial No. 9482551Rated (full load Horsepower: 270 Horsepower)Observed (dynamometer) Horsepower: 260 HorsepowerCalculations:
Measured API gravity: 39.6° API at 50°F (round to 40° API)
Corrected API Gravity (see chart): 41° API at 60°F
Horsepower Correction Factor (see chart): 1.038
Corrected Horsepower = Observed Horsepower x Horsepower Correction Factor 260 horsepower x 1.038 = 270 horsepower(Although the dynamometer indicated low horsepower, if the proper fuel had been used, the engine would be operating at rated output. The factory tolerance on rated engine output is 3%.)REFERENCE: For more information on dynamometer testing diesel engines, see Special Instruction Form GEG01024 .Diesel Fuel API Gravity to IbsJU.S. gallon or kg/liter Conversion Chart
The following chart may be used to convert the fuel API gravity to Ibs./U.S. gallon or kg/liter. These weights are for reference and are to be used when evaluating engine performance. Measurement of fuel flow rates can be converted