Information injection-pump assembly
BOSCH
9 400 619 559
9400619559
ZEXEL
101696-9902
1016969902
NISSAN-DIESEL
16713Z6873
16713z6873

Rating:
Service parts 101696-9902 INJECTION-PUMP ASSEMBLY:
1.
_

7.
COUPLING PLATE
8.
_
9.
_
11.
Nozzle and Holder
16600-Z5677
12.
Open Pre:MPa(Kqf/cm2)
16.7{170}/19.6{200}
14.
NOZZLE
Cross reference number
BOSCH
9 400 619 559
9400619559
ZEXEL
101696-9902
1016969902
NISSAN-DIESEL
16713Z6873
16713z6873
Zexel num
Bosch num
Firm num
Name
Calibration Data:
Adjustment conditions
Test oil
1404 Test oil ISO4113 or {SAEJ967d}
1404 Test oil ISO4113 or {SAEJ967d}
Test oil temperature
degC
40
40
45
Nozzle and nozzle holder
105780-8260
Bosch type code
9 430 610 133
Nozzle
105780-0120
Bosch type code
1 688 901 990
Nozzle holder
105780-2190
Opening pressure
MPa
18
Opening pressure
kgf/cm2
184
Injection pipe
Outer diameter - inner diameter - length (mm) mm 6-2-600
Outer diameter - inner diameter - length (mm) mm 6-2-600
Overflow valve
131425-0420
Overflow valve opening pressure
kPa
157
123
191
Overflow valve opening pressure
kgf/cm2
1.6
1.25
1.95
Tester oil delivery pressure
kPa
255
255
255
Tester oil delivery pressure
kgf/cm2
2.6
2.6
2.6
Direction of rotation (viewed from drive side)
Right R
Right R
Injection timing adjustment
Direction of rotation (viewed from drive side)
Right R
Right R
Injection order
1-4-2-6-
3-5
Pre-stroke
mm
3.1
3.05
3.15
Beginning of injection position
Drive side NO.1
Drive side NO.1
Difference between angles 1
Cal 1-4 deg. 60 59.5 60.5
Cal 1-4 deg. 60 59.5 60.5
Difference between angles 2
Cyl.1-2 deg. 120 119.5 120.5
Cyl.1-2 deg. 120 119.5 120.5
Difference between angles 3
Cal 1-6 deg. 180 179.5 180.5
Cal 1-6 deg. 180 179.5 180.5
Difference between angles 4
Cal 1-3 deg. 240 239.5 240.5
Cal 1-3 deg. 240 239.5 240.5
Difference between angles 5
Cal 1-5 deg. 300 299.5 300.5
Cal 1-5 deg. 300 299.5 300.5
Injection quantity adjustment
Adjusting point
-
Rack position
13.1
Pump speed
r/min
700
700
700
Average injection quantity
mm3/st.
105
103.4
106.6
Max. variation between cylinders
%
0
-3.5
3.5
Basic
*
Fixing the rack
*
Standard for adjustment of the maximum variation between cylinders
*
Injection quantity adjustment_02
Adjusting point
Z
Rack position
9.2+-0.5
Pump speed
r/min
400
400
400
Average injection quantity
mm3/st.
20
18.2
21.8
Max. variation between cylinders
%
0
-10
10
Fixing the rack
*
Standard for adjustment of the maximum variation between cylinders
*
Injection quantity adjustment_03
Adjusting point
A
Rack position
R1(13.1)
Pump speed
r/min
700
700
700
Average injection quantity
mm3/st.
105
104
106
Basic
*
Fixing the lever
*
Boost pressure
kPa
32.7
32.7
Boost pressure
mmHg
245
245
Injection quantity adjustment_04
Adjusting point
B
Rack position
R1+1.35
Pump speed
r/min
1400
1400
1400
Average injection quantity
mm3/st.
106
102
110
Fixing the lever
*
Boost pressure
kPa
32.7
32.7
Boost pressure
mmHg
245
245
Injection quantity adjustment_05
Adjusting point
D
Rack position
(R2-1.5)
Pump speed
r/min
400
400
400
Average injection quantity
mm3/st.
76.5
74.5
78.5
Fixing the lever
*
Boost pressure
kPa
0
0
0
Boost pressure
mmHg
0
0
0
Injection quantity adjustment_06
Adjusting point
I
Rack position
-
Pump speed
r/min
150
150
150
Average injection quantity
mm3/st.
140
140
150
Fixing the lever
*
Boost pressure
kPa
0
0
0
Boost pressure
mmHg
0
0
0
Rack limit
*
Boost compensator adjustment
Pump speed
r/min
400
400
400
Rack position
(R2-1.5)
Boost pressure
kPa
6.7
5.4
8
Boost pressure
mmHg
50
40
60
Boost compensator adjustment_02
Pump speed
r/min
400
400
400
Rack position
R2(R1+0.
05)
Boost pressure
kPa
19.3
19.3
19.3
Boost pressure
mmHg
145
145
145
Timer adjustment
Pump speed
r/min
-
Advance angle
deg.
1
0.5
1.5
Remarks
Measure speed (beginning of operation).
Measure speed (beginning of operation).
Timer adjustment_02
Pump speed
r/min
-
Advance angle
deg.
0
0
0
Remarks
Measure the actual speed.
Measure the actual speed.
Timer adjustment_03
Pump speed
r/min
-
Advance angle
deg.
0
0
0
Remarks
Measure the actual speed.
Measure the actual speed.
Timer adjustment_04
Pump speed
r/min
-
Advance angle
deg.
4.5
4
5
Remarks
Measure the actual speed, stop
Measure the actual speed, stop
Test data Ex:
Governor adjustment
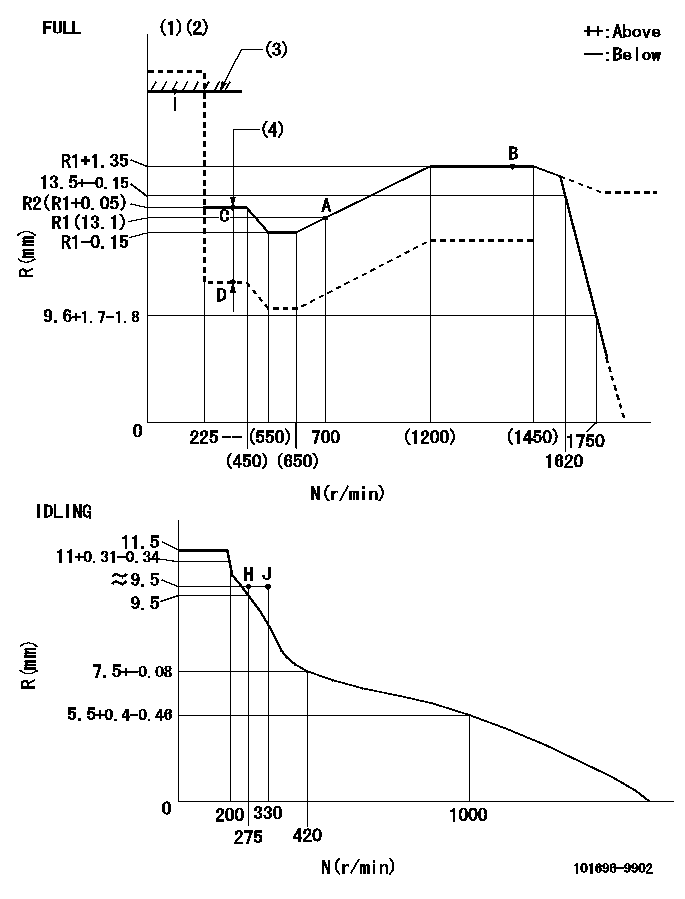
N:Pump speed
R:Rack position (mm)
(1)Torque cam stamping: T1
(2)Tolerance for racks not indicated: +-0.05mm.
(3)RACK LIMIT
(4)Boost compensator stroke: BCL
----------
T1=M83 BCL=(1.5)mm
----------
----------
T1=M83 BCL=(1.5)mm
----------
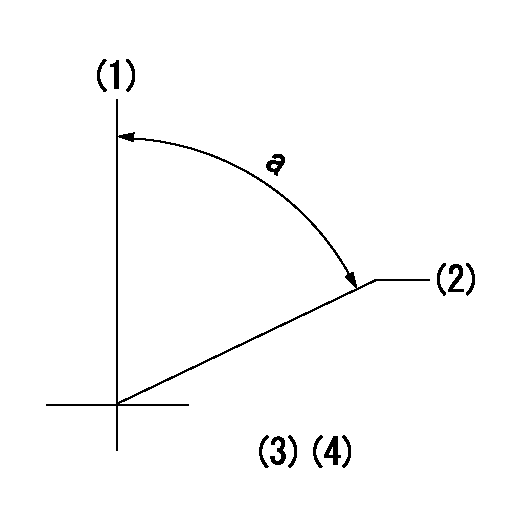
Speed control lever angle

F:Full speed
I:Idle
(1)Use the hole at R = aa
(2)Stopper bolt set position 'H'
----------
aa=36mm
----------
a=25deg+-5deg b=41deg+-3deg
----------
aa=36mm
----------
a=25deg+-5deg b=41deg+-3deg
Stop lever angle

N:Pump normal
S:Stop the pump.
(1)Use the pin at R = aa
----------
aa=42mm
----------
a=40deg+-5deg b=25deg+-5deg
----------
aa=42mm
----------
a=40deg+-5deg b=25deg+-5deg
0000001501 RACK SENSOR
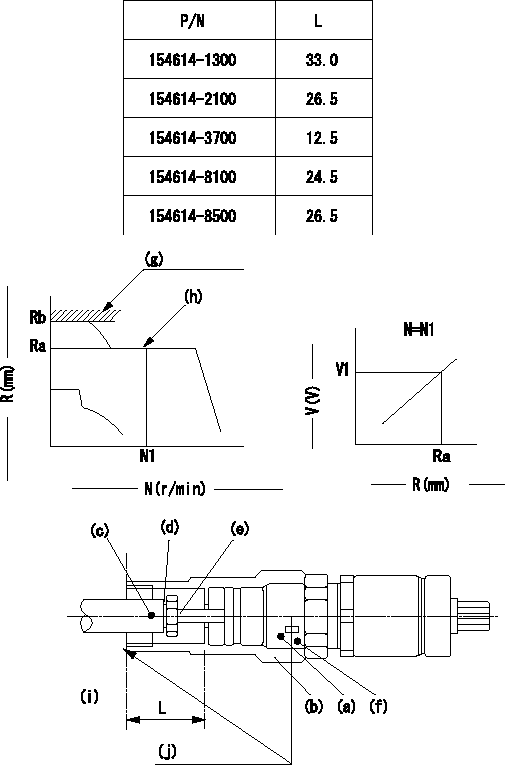
(g) rack limit
(h) rack sensor performance confirmation position
(i) pump end face
(j) Apply red paint.
Rack sensor adjustment (-5*20, threaded type, with A type rack limiter)
1. Rack limit adjustment
(1)When installing joint (b), select a shim (d) so that the rack limit rack position is Ra.
(2)Install rod (E) to the rack (c).
(3)Select a joint (b) from the table above so that the distance from the pump end face to the rod (e) is L - 0.2 mm at rack position Rb.
2. Rack sensor adjustment
(1)Screw in the bobbin (A) until it contacts the joint (B).
(2)Fix the lever and set the pump speed at N1 and the rack position at Ra.
(3)Adjust the amount that the bobbin (a) is screwed in so that the amp's output voltage is V1. Then, fix using nut (f).
(4)Set the lever at the full speed side and confirm that the amp's output voltage is V1.
(5)Stick the caution plate on the top of the joint and apply red paint to the joint (b) and nut (f) join, and to the pump end face and joint (b) join.
Speed N1, Rack position = Ra, output voltage V1+-0.01 (V), rack sensor supply voltage 5+-0.01 (V)
----------
Ra=R1(13.1)mm Rb=R1+1.5mm N1=700r/min V1=3+-0.01V
----------
----------
Ra=R1(13.1)mm Rb=R1+1.5mm N1=700r/min V1=3+-0.01V
----------
Timing setting
(1)Pump vertical direction
(2)Position of timer's threaded hole at No 1 cylinder's beginning of injection
(3)-
(4)-
----------
----------
a=(60deg)
----------
----------
a=(60deg)
Information:
Cooling System Diagram
Illustration 18 g00594718
Touch the icon for the cooling system on the navigation bar in order to view the window. The window displays the cooling system parameters. The window also displays a system diagram.Touch the gauge in the upper right hand corner in order to see a real time data for the cooling system.Real Time Data for the Cooling System
Illustration 19 g00562789
"Cooling System" Screen
Illustration 20 g00562791
SymbolsTouch the gauge in the upper right hand corner in order to see a real time data for the cooling system. The window has gauges and a trend chart in real time. An hour of real time data is displayed.Touch the gauge in order to see the trends. The trend chart only shows one parameter at one time.Touch the after cooler and oil cooler water inlet temperature gauge in order to see the trend on the graph.Touch the icon in the upper right corner of the window in order to return to the cooling system diagram.The critical limits are shown with a yellow mark on the gauge. Engine shutdown conditions are shown with a red mark on the gauge.Exhaust
Exhaust Port Temperatures
Illustration 21 g00562793
Touch the exhaust icon on the navigation bar in order to view the window for the exhaust port temperature. The exhaust port temperatures are represented by a bar graph. The actual exhaust temperature is shown with a blue mark. The normal operating temperature range for each port is shown with a green mark. The variation of the critical limits are shown with yellow marks. The critical limit is shown with a yellow mark. The average port temperature is shown with a purple mark. Touch the "Deviation" button in order to view the exhaust port temperature deviation.Touch the trend icon in order to view the stack temperatures and the manifold temperatures as well as trends in real time. Exhaust Port Temperature Deviation
Illustration 22 g00562798
Touch the "Deviation" button on the "Exhaust Port Temperatures" window in order to view the Exhaust Port Temperature Deviation. The window shows the deviation from the average for each port temperature. The yellow marks are the maximum temperature deviation. This is the deviation that is allowed above the average temperature and below the average temperature.Touch the button with the arrows and the bar graph in order to return to the "Exhaust Port Temperatures" window.Exhaust Stack and Manifold
Illustration 23 g00562800
Touch the trend icon on the "Exhaust Port Temperatures" window in order to view the "Exhaust Manifold and Stack Temperatures" window. The actual exhaust manifold temperature and stack temperature will be a blue color. The variation of the normal operating temperature for the exhaust manifold and the stack temperature is shown as a green color. The variation of the critical limits are shown with yellow marks. The critical limit is shown with a yellow mark. The average port temperature is shown with a purple mark. Touch the trends icon in order to view the stack temperatures and manifold temperatures. This button also shows trends in real time.Touch the arrow icon in order to return to the