Information injection-pump assembly
ZEXEL
101606-0001
1016060001
ISUZU
8943906054
8943906054

Rating:
Cross reference number
ZEXEL
101606-0001
1016060001
ISUZU
8943906054
8943906054
Zexel num
Bosch num
Firm num
Name
Calibration Data:
Adjustment conditions
Test oil
1404 Test oil ISO4113 or {SAEJ967d}
1404 Test oil ISO4113 or {SAEJ967d}
Test oil temperature
degC
40
40
45
Nozzle and nozzle holder
105780-8260
Bosch type code
9 430 610 133
Nozzle
105780-0120
Bosch type code
1 688 901 990
Nozzle holder
105780-2190
Opening pressure
MPa
18
Opening pressure
kgf/cm2
184
Injection pipe
Outer diameter - inner diameter - length (mm) mm 6-2-600
Outer diameter - inner diameter - length (mm) mm 6-2-600
Overflow valve
131424-8620
Overflow valve opening pressure
kPa
206
172
240
Overflow valve opening pressure
kgf/cm2
2.1
1.75
2.45
Tester oil delivery pressure
kPa
255
255
255
Tester oil delivery pressure
kgf/cm2
2.6
2.6
2.6
Direction of rotation (viewed from drive side)
Left L
Left L
Injection timing adjustment
Direction of rotation (viewed from drive side)
Left L
Left L
Injection order
1-5-3-6-
2-4
Pre-stroke
mm
3.8
3.75
3.85
Rack position
Point A R=A
Point A R=A
Beginning of injection position
Governor side NO.1
Governor side NO.1
Difference between angles 1
Cal 1-5 deg. 60 59.5 60.5
Cal 1-5 deg. 60 59.5 60.5
Difference between angles 2
Cal 1-3 deg. 120 119.5 120.5
Cal 1-3 deg. 120 119.5 120.5
Difference between angles 3
Cal 1-6 deg. 180 179.5 180.5
Cal 1-6 deg. 180 179.5 180.5
Difference between angles 4
Cyl.1-2 deg. 240 239.5 240.5
Cyl.1-2 deg. 240 239.5 240.5
Difference between angles 5
Cal 1-4 deg. 300 299.5 300.5
Cal 1-4 deg. 300 299.5 300.5
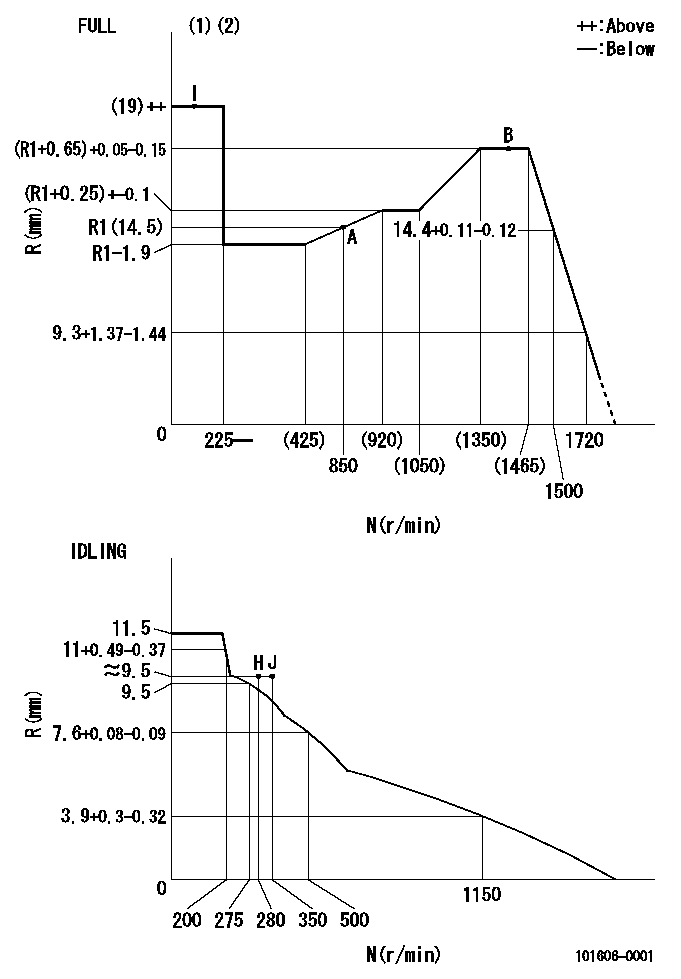
Injection quantity adjustment
Adjusting point
-
Rack position
14.5
Pump speed
r/min
850
850
850
Average injection quantity
mm3/st.
133.5
131.9
135.1
Max. variation between cylinders
%
0
-2.5
2.5
Basic
*
Fixing the rack
*
Standard for adjustment of the maximum variation between cylinders
*
Injection quantity adjustment_02
Adjusting point
Z
Rack position
9.5+-0.5
Pump speed
r/min
300
300
300
Average injection quantity
mm3/st.
15.5
14.2
16.8
Max. variation between cylinders
%
0
-14
14
Fixing the rack
*
Standard for adjustment of the maximum variation between cylinders
*
Injection quantity adjustment_03
Adjusting point
A
Rack position
R1(14.5)
Pump speed
r/min
850
850
850
Average injection quantity
mm3/st.
133.5
132.5
134.5
Basic
*
Fixing the lever
*
Injection quantity adjustment_04
Adjusting point
B
Rack position
(R1+0.65
)+0.05-0
.15
Pump speed
r/min
1450
1450
1450
Average injection quantity
mm3/st.
127
123.8
130.2
Fixing the lever
*
Test data Ex:
Governor adjustment
N:Pump speed
R:Rack position (mm)
(1)Torque cam stamping: T1
(2)Tolerance for racks not indicated: +-0.05mm.
----------
T1=N11
----------
----------
T1=N11
----------
Timer adjustment
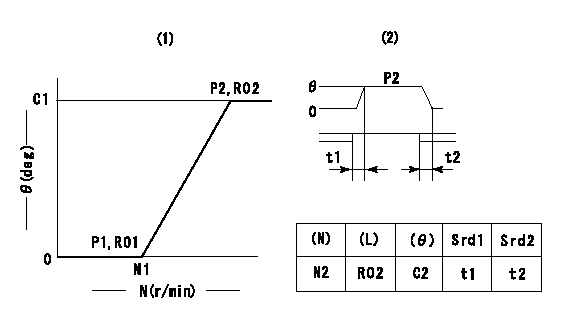
(1)Adjusting range
(2)Step response time
(N): Speed of the pump
(L): Load
(theta) Advance angle
(Srd1) Step response time 1
(Srd2) Step response time 2
1. Adjusting conditions for the variable timer
(1)Adjust the clearance between the pickup and the protrusion to L.
----------
L=1.5+-0.2mm N2=800r/min C2=(8deg) t1=2--sec. t2=2--sec.
----------
N1=1300++r/min P1=0kPa(0kgf/cm2) P2=392kPa(4kgf/cm2) C1=8+-0.3deg R01=0/4load R02=4/4load
----------
L=1.5+-0.2mm N2=800r/min C2=(8deg) t1=2--sec. t2=2--sec.
----------
N1=1300++r/min P1=0kPa(0kgf/cm2) P2=392kPa(4kgf/cm2) C1=8+-0.3deg R01=0/4load R02=4/4load
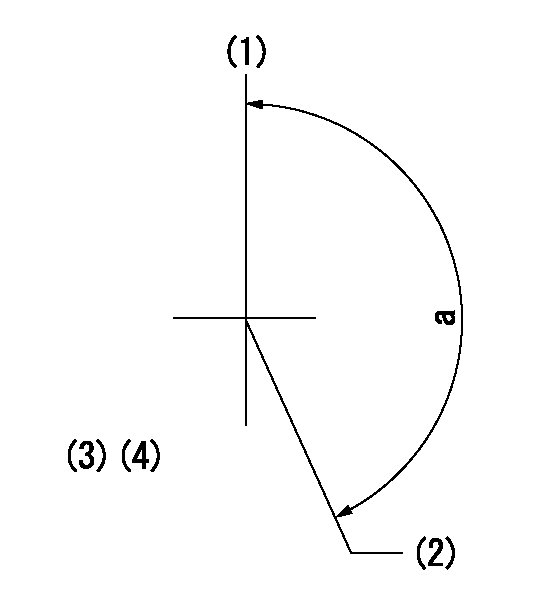
Speed control lever angle
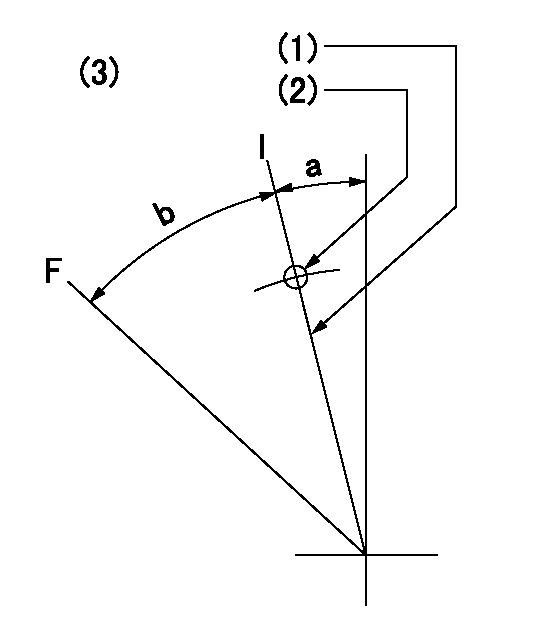
F:Full speed
I:Idle
(1)Stopper bolt set position 'H'
(2)Use the pin at R = aa
(3)Viewed from feed pump side.
----------
aa=35mm
----------
a=10deg+-5deg b=40deg+-3deg
----------
aa=35mm
----------
a=10deg+-5deg b=40deg+-3deg
Stop lever angle
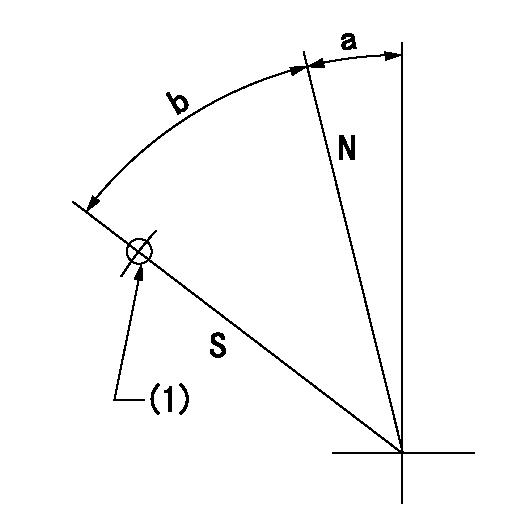
N:Pump normal
S:Stop the pump.
(1)Use the pin at R = aa
----------
aa=45mm
----------
a=12.5deg+-5deg b=40deg+-5deg
----------
aa=45mm
----------
a=12.5deg+-5deg b=40deg+-5deg
0000001501 RACK SENSOR
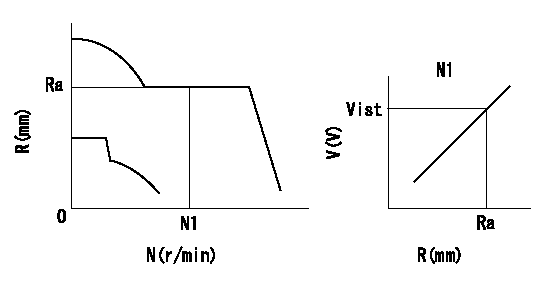
Rack sensor adjustment
1. Flange type rack sensor (rack sensor adjustment -5*20)
(1)These types of rack sensors do not need adjustment. Confirm the performance with the following procedures.
(2)Mount the rack sensor main body to the pump main body.
(3)Fix the pump lever at full.
(4)At supply voltage V1, pump speed N1 and rack position Ra, confirm that the amp's output voltage is Vist.
(5)Move the pump lever two or three times.
(6)Set again to full.
(7)Confirm that the amplifier output voltage is Vist.
(8)Fix the caution plate to the upper part of the rack sensor.
(For those without the caution plate instructions, make sure the nameplate of the rack sensor carries the "Don't hold here" caution.)
(9)Apply red paint to the rack sensor mounting bolts (2 places).
----------
V1=5+-0.01V N1=850r/min Ra=R1(14.5)mm Vist=3.74+-0.28V
----------
----------
V1=5+-0.01V N1=850r/min Ra=R1(14.5)mm Vist=3.74+-0.28V
----------
Timing setting
(1)Pump vertical direction
(2)Positions of coupling's threaded installation holes at No 1 cylinder's beginning of injection
(3)B.T.D.C.: aa
(4)-
----------
aa=6deg
----------
a=(160deg)
----------
aa=6deg
----------
a=(160deg)
Information:
Operating Cost Information
The term "Life Cycle Cost" can be defined as the sum of the individual costs experienced by an engine from the day of purchase until the day of retirement. In other words, the total Owning and Operating Costs.Owning Costs are fixed costs such as initial purchase price, interest on borrowed money, depreciation and taxes.Operating Costs are a combination of fixed and variable costs such as fuel, oil, operator expenses, road taxes, tires, chassis maintenance and repair, permits, licenses, engine maintenance and repair and downtime.The difference between revenues generated and Life Cycle Costs (total Owning and Operating Costs) is profit.Caterpillar and your Caterpillar dealer cannot guarantee that you will make a profit. However, Caterpillar and your Caterpillar dealer can provide you with a variety of services that can help you reduce the costs that impact your profits.An Engine Operating Cost Analysis is a service provided by your dealer that was developed by Caterpillar to help you reduce the Life Cycle Cost of your engine.More specifically, an Engine Operating Cost Analysis is a computerized program that examines existent and expectant oil, fuel, maintenance, minor repair, overhaul and downtime costs for the period of time you expect to own the engine. It also calculates the operating cost per mile (km), hour or day.This useful tool provides your dealer with the specific information needed to develop a customized Maintenance Management program for your operation which will minimize your engine's operating costs.Before a cost analysis can be performed, your dealer needs to gather as much information as possible about your operation. He will need to know the length of time you plan to keep your engine/vehicle, your average cost of fuel and oil as well as a variety of other ownership and cost related facts and figures.Once this information is obtained, your dealer will enter the data into an established computerized program to produce an Engine Operating Cost Analysis printout reflecting your current and projected operating costs per mile (km), hour or day.The typical printout of the Engine Operating Cost Analysis program has up to four engine scenarios which can be run at one time. The printouts is divided into three major areas: * General Information* Engine Operating Information* Operating Cost SummaryGeneral Information
The General Information section contains basic user data such as name, business, location, ownership, usage per year etc., information.Engine Operating Information
The Engine Operating Information section is divided into eight subsections that address fuel consumption, oil consumption, preventive maintenance, component repairs such as water pumps, turbochargers, air compressors, etc., before failure repairs, after failure repairs, user's revenue rate per hour and lastly, miscellaneous costs such as operator wages, insurance premiums, etc.Current and expected cost information reflected in the Engine Operating Information section is based on the data provided by you. These are the costs that affect your engine's operating cost.Operating Cost Summary
The Operating Cost Summary section is exactly what it implies, a summary. Here the total dollar expense and percentage of the total operating expense is calculated for each of